2018 — a year of
continued optimism
The 2018 Construction Industry Forecast summarizes the findings from a nationwide survey of construction executives. The results show that contractors and equipment distributors have an extremely positive outlook for construction activity in 2018.
View the full report to find out when they expect construction activity to pick up, and what expectations are for net profits and rental trends in 2018.
Survey findings and what they mean
Watch a replay of the live webcast as John Crum, Wells Fargo Equipment Finance Construction Group national sales manager, discusses the 2018 Construction Industry Forecast survey findings with economic experts and financing specialists. Learn what contractors and distributors are expecting for 2018. Topics include industry optimism, trends in the rental market, equipment purchase intentions, expectations for net profits, and more.
John Crum: Good morning, everybody.
Thank you for joining us today to discuss the 2018 Wells Fargo Construction Industry Forecast.
My name is John Crum. I’m the National Sales Manager for the Construction Group of Wells Fargo Equipment Finance. With me today, Byron Payne, head of Specialty Industries Wells Fargo Equipment Finance, Peter Gregory, Senior Sales Manager for National Accounts and Dealer Inventory Finance Wells Fargo, as well as joining us on the line, Mark Vitner, Managing Director and Senior Economist with Wells Fargo Securities.
Thank you, everybody, for being here today. We’re excited to talk about the forecast.
So if you are joining us, you’re probably aware, we have just released today our annual 2018 outlook for the construction industry. What we’re here to talk about are the results of the national survey of the construction survey executives that was completed in late 2017.
It is the 42nd annual survey, the 42nd time that we have surveyed executives to get their opinions about various topics that are important to our three key constituents. Those constituents are end-users and contractors, equipment distributors and rental companies, as well as equipment manufacturers.
In the report, you will find a bunch of information, but the highlight of it is our annual Optimism Quotient.
The Optimism Quotient is really a confidence index, and what it does is measure the survey respondents’ expectations for 2018 and whether it will be better or worse than 2017.
What it doesn’t do is predict any increases or decreases in activity, but it just tells us whether or not in the local area that the respondents service whether activity will be higher or lower than the year just preceding. A couple of things before we get started about the numbers. When you see readings, it is a scale. Anything on the scale of over 100 is considered highly optimistic. Anything between 75 and 99 would be cautiously optimistic and any reading below 75 is a pessimistic outlook. So jumping right into it …
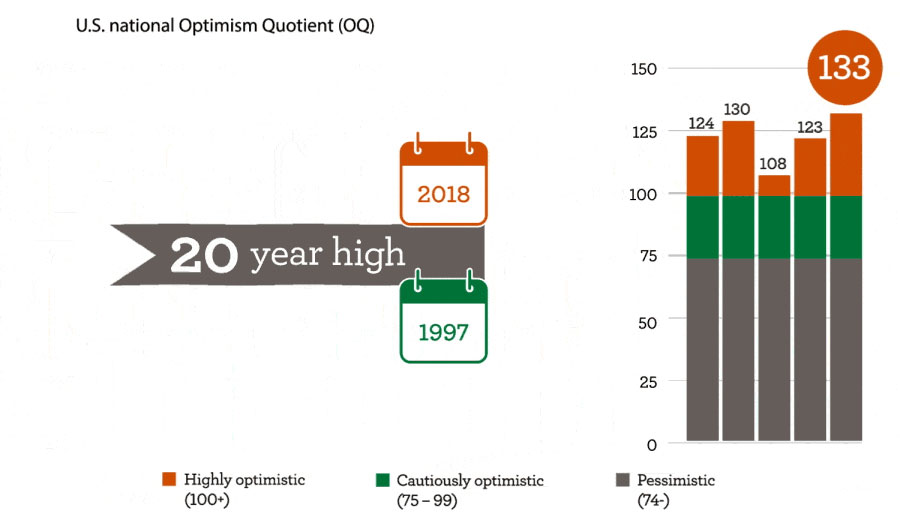
For 2018, the Optimism Quotient is a very optimistic, 133.
In fact, it’s the highest number that we recorded in the last 20 years.
If you read our press release this morning, we’ll call it the highest Optimism Quotient this century.
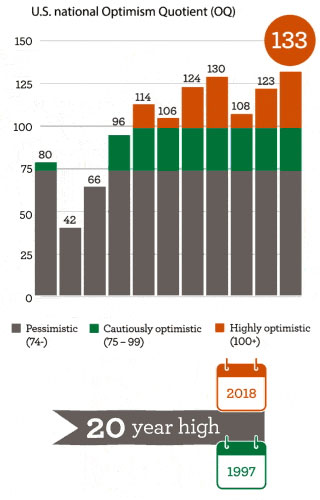
We’re going to talk in a couple slides coming up about what it looked like since 1997 but what you see on your screen right now are the results from 2014 through the current period and you’ll see if you have been in the industry, you can see we’re in the highly optimistic category and highly optimistic territory, and if you are a participant, it probably feels about right to you. Jumping ahead to or you know, looking back, I guess, to 1997 over the last 20 years, again, for those of you who are participants in the industry, these slides should feel very familiar. Particularly if you look at the real dip in optimism that occurred in 2008, 2009, 2010, we were squarely in the pessimistic category there as we all know, we’re in a great recession.
Before I talk about it anymore and we go to any other slides, maybe, Byron, as you look at this and in your role as head of Specialty Industries, how does it feel to you in terms of business activity for the businesses you manage?
Byron Payne: There’s no question it bodes well for the construction industry; it’s great to see Optimism Quotient of a 133, the greatest in the last 20 years. And since we’ve done the survey, John, there are other items that bolster that and support that fact. Shipment of non-defense capital goods are on the rise. Capital goods orders are on the rise and another thing I experienced in my 20 – 30 years in the business and really 20 years’ experience with this OQ is it also bodes well for some of other industries Wells Fargo Equipment Finance operates in and we’re looking forward to 2018, not only in the construction industry but really, quite honestly, all industries that we participate in at Wells Fargo Equipment Finance.
John Crum: Really good. It’s probably fair to say that our business pretty closely follows the overall Optimism Quotient here if we look at it at least for the last 20 years.
Byron Payne: It is. It’s a pretty high correlation, like I said, not only for construction but for a number of our businesses. There’s always a couple of businesses maybe that are counter-cyclical to what we see in the OQ in the construction space but a lot of them will follow suit.
John Crum: Excellent.
So one of the things we do in the survey is we measure the various constituencies and we look for differences in optimism between contractors and distributors.
If we look back on historical basis, it’s true for at least the last 20 years that distributors and rental companies have been more optimistic than contractors.
Peter, why don’t you take this one and tell us a little bit about your experience in terms of why distributors might be more optimistic, in general, than contractors?
Peter Gregory: Thank you. Historically, we have seen distributors have always been a lot more optimistic. Their opinion is usually that the contractors need the latest and greatest equipment and they’re confident in their abilities to sell that. The contractors have to take a different view. They have to realize that if they buy the equipment, they’re taking on that debt.
So they’ve got to make sure that the backlogs are strong. They have to have them out long enough and they’re watching our OQ, to see how the industry is going to perform before they can make the decision whether they need to buy the equipment or rent the equipment.
John Crum: Yeah.
One of the things we see when we talk to contractors and we ask about this, they say, well, we have to bid every job on the lowest cost, lowest cost provider wins that award, so we’re more pessimistic by nature because everything is judged by price only and that’s one of the things that we see here. There’s a pretty big gap in optimism between contractors and distributors. That’s not to say that contractors aren’t optimistic. 127 is squarely in the highly optimistic category, so nothing to be concerned on here, just a notable difference between maybe your perspective in the industry and where you fall in on that.
Peter Gregory: One observation when I was looking at the some of the detail behind the numbers for a reason why the gaps are higher this year than maybe it was back in 2016 when it was only about a three-point gap, if we look at the respondents on the distributors’ side, 24% of respondents came from energy states, so I think they’re pretty optimistic that they’re going to sell more equipment in these energy states and with the price of oil up.
Meanwhile, only 6% of the contractors labeled themselves as oil and gas contractors. That may also serve to lead a larger gap in 2018.
John Crum: That’s a good point. A lot of those details are in the full booklet available for download. Thank you for pointing that out.
Peter Gregory: I think we saw that, Baron, in our clients in the ’15 and ’16 period, the middle part of the country, the oil and gas states, they had much depressed results versus the other ones.
John Crum: So one of the things that’s back this year in the forecast is comparing the Optimism Quotient to other major indices that we think are primary drivers or indicators for the construction industry. With us on the line, Mark, I hope you can hear us, but Mark Vitner, our Senior Economist will talk about how the OQ compares to a number of other key indexes in the construction industry, and the first one we have on the screen is the OQ versus Total Construction going back to 1996. Mark, if you could take this one. I would appreciate some commentary on it.
I apologize to everybody. In fairness, Mark is traveling in the state of Louisiana. I believe he’s on his way from the New Orleans to Baton Rouge or the other way around. Connectivity may be a little bit spotty, but going off of what we see.
I will fill in here. We were prepared for this eventuality.
One of the things we point out is obviously we like to see how we’re doing in terms of the measurement.
Is the Optimism Quotient something that’s relevant as a piece of information as it compares to the overall industry? If you look at the slide on your screen, what you will see the line in black, which is the scale on the right, is Total Construction put in place in the U.S. And the blue line on your screen is the Optimism Quotient. So in terms of an indicator or something that can be judged on what the actual activity is, you know, looking back, the OQ has been really kind of a good predictor of overall activity as it relates to total construction in the U.S.
If you are evaluating whether or not this particular piece of information or this index is relevant to you, I would say this is one of the key things to take a look at here.
Peter Gregory: Definitely, John.
One thing to keep in mind and when you are looking at the graphs, too, the energy boom really started in ’09 and that’s when you started to see the numbers start increasing on the positive side.
John Crum: Great. So I understand we have Mark back now.
So Mark, we were just talking about the OQ versus total construction.
If you can hear us, thoughts on OQ as it relates to total construction as it goes back really for the last 20 years?
Mark Vitner: Well, there’s been a pretty tight relationship over time and we did have this disconnect around the recession where actual construction spending did not fall as far as the OQ did. And the reason that occurred were two-fold. You had the energy boom that began with nat gas and then went into oil and supported construction spending, and then we had some infrastructure building as well. That held up overall construction activity although the private sector did not fair near as well. The private sector fell off quite a bit.
I think in this particular case, the survey picked up the weakness in the private sector much better than it did the overall construction spend.
John Crum: Yeah. Thank you for that.
I know we’re going to talk a little bit about the public spend coming up in a minute, but maybe we should flip over to another index and as you and I have talked about it, Industrial Production being maybe a little bit more of a measure of the overall health of U.S. economy particularly on the manufacturing side and as we look on our screen, OQ versus overall industrial production, any emphasis or any thoughts that we can draw on as it relates to this?
Mark Vitner: The industrial production numbers are some of the most cyclically sensitive economic data that we get because it is largely driven by what goes on in manufacturing and also includes mines and utilities. So utilities are given more stability because people have to stay warm and cool themselves off even in the midst of a recession. But there’s a very tight relationship here. And again, some of the improvement early on reflected the rebound in the energy sector, and we’ve also had a solid recovery in manufacturing.
Some of that reflects increased production of construction equipment, mining equipment that went along with the mining boom and more recently with the improvement in global economic growth. 2017 was the first year that every OECD country, and there’s 35 OECD countries and all thirty-five grew in the same year. That was the first time that happened since 1997. That was actually the strongest since 2007 and the strongest growth since 1997. That improvement in the global economy has led to increased business confidence and construction projects that were put on hold and are beginning to move forward again.
John Crum: Great. Thank you for that commentary.
One of the ones that I like to follow and that we evaluate with the help of our business in the construction industry is Architectural Billings and a lot of people refer to this one as a leading indicator. You’ve got some good thoughts as it relates to Architectural Billings Index as a leading indicator and we’ve talked some about it, how it relates to the Optimism Quotient. Maybe you can walk us through what architectural billings are or what the index is, and how it relates to our confidence index.
Mark Vitner: Architectural billings are contracts for design services. Early on in the development process, developers will contract out with architects for the plans of buildings and in some cases, they know exactly where they’re going and others are still looking for the right spot, but they tend to be a fairly reliable leading indicator of construction spending, particularly on the upside, and of course, our Optimism Quotient is also a look at the year ahead.
This chart has some of the biggest and tightest relationship of any of the comparisons that we have. Although our Optimism Quotient is looking at the year ahead and we have just the latest billing data through 2017.
And I think that it’s encouraging that given the upswing in the OQ that we’re likely to see the architectural billings to improve and virtually all the leading indicators of commercial construction actually or construction activity, in general, are in positive territory, but the big improvement is really on the commercial side.
John Crum:
Thank you for that. You have mentioned Private Construction in one of your opening slides and one of the opening comments and we have up on the screen now, OQ versus overall Private Construction.
And I think this indicates a little bit of what you were talking about there.
But thoughts on Private Construction as it relates to how someone might use this survey looking at something like this?
Mark Vitner: I think the relationship between the Optimism Quotient and construction is strongest at the private sector because in the public sector, projects are not necessarily driven by the business cycle.
In fact, when we go into recession, there’s always a big push to get more public construction and so it’s not surprising that you get some deviations between the two series, but the private sector — the strong ties with the private sector really feed into everything else that we’re seeing in the economy, and when people ask me, you know, how do you figure out what’s going on with the broader economy, there’s so many conflicting signals and I tell them that it’s important to look for things that are consistent and inconsistent. The more pieces of economic data that are consistent with the improving trend, the better. That’s what this chart shows me right now is that the pickup in optimism has coincided with the earlier upswing in the private commercial construction or private construction spending and the further improvement that we’re seeing in the Optimism Quotient tells me that — it gives me a high degree of confidence that we’re going to see continued improvement in 2018. Pretty much along the lines that we saw in the last two years.
John Crum: So Mark, one of the things that we’ve noticed is really private construction and particularly private infrastructure construction and private nonresidential construction was a driver of the construction industry in 2017 for certain.
What are your thoughts on the sustainability of private investment continuing to drive the construction market?
Mark Vitner: Well, I think we’re almost definitely headed for a very good year in 2018.
Tax reform is a strong tailwind for us right now and the ability to completely depreciate our expense, the cost of equipment is a strong positive attitudes toward business have changed in a major way. When business owners feel more confident about expanding their business and hiring more workers, building new plants and buying more equipment, all of those things I think are going to feed into a much better environment for construction.
Some of the concerns that we have are more on the supply side.
While the demand seems to be picking up, there are some concerns about the ability to get the workers that are needed to build all the things the folks are hoping to build.
John Crum: Right. That’s one of the things that is consistent in our survey we have heard concerns from the industry about their concerns over hiring and labor. And we are going to talk about this. We have some material to discuss as part of this webcast that we’re doing today. But speaking of consistent, I’d like to put up a slide that doesn’t really appear to be consistent, and if we look at the two slides, the first one is the Optimism Quotient versus Public Nonresidential Construction, and then versus overall Nonresidential Construction. The scales are pretty significantly different, so make sure we’re looking at those.
What would you attribute that gap between where optimism was going down in ’08, ’09, ’10 and public non-res was going up and at the same time overall non-res, because there’s a couple factors going into that. What are your thoughts on why the gap there?
Mark Vitner: Public non-res, that’s government projects, that’s public works, and they tend to pick up in the midst of a recession and certainly, they did this time as well. A lot of the shuttle-ready projects that we heard about in 2009 consisted of paving projects. They were things that can immediately be done and didn’t require new environmental studies. There weren’t a whole lot of shuttle-ready projects, but there were enough that it pushed the needle a little bit and that did better right as the private sector was tanking, or much of the private sector was tanking. And most of the companies that we’re, if not all of the companies that we’re surveying, are private companies.
They were much more reflective of the deep recession that we endured in 2008 and early 2009 when the public construction spending was.
Had the survey been limited to contractors and firms that were equipment dealers that had disproportionate share of their business to the government, there probably would have been a tighter relationship here. I remember that during that time, the Washington, D.C., economy was doing quite well compared to the rest of the country was struggling.
John Crum: Absolutely.
Mark Vitner: And I think that same tendency explains the disconnect between overall nonresidential because public’s a big part of that. That’s what’s behind the disconnect. There’s a stronger relationship on the upside. The two are moving more closely together now and even though there’s a lot of talk about infrastructure, and I do think that the President’s going to get something done on infrastructure, probably not the $1.5 trillion over ten years and he’s looking for, but certainly, they’re looking to streamline the environmental permitting process and hopefully speed up some projects that are in the pipeline. But, I think that this relationship should be fairly strong going forward.
John Crum: I think if we extended this out, you know, going back to prior to 2002, the relationship would be pretty consistent with just that gap.
So one of the things and there’s a couple other factors going into overall nonresidential construction and we talked about the energy boom kind of coinciding with the time, the dip in the great recession and while all this spending was going on in overall non-res, it might have been limited to a sector or two, and concentrated in a number of states. Is that pretty consistent with your evaluation of it?
Mark Vitner: That’s a big part of it, too. At the time the oil prices peaked, when they were over $100 a barrel, about 37% of all office construction in the country was in the Houston metropolitan area and another 16% was in Dallas. And then if you threw in some of the other oil cities like Denver and Oklahoma city, which also had some good
John Crum: I remember when we did the survey back in those years, we broke out what we call the energy states to see where the anomalies were and that pointed to a lot of the inconsistencies there. There was really a higher concentration of activity going on in the areas that were blessed with all of this activity that’s going on there and then, you know, the rest of country was kind of feeling the pain. Peter, is that pretty consistent with what the dealers were telling you at the time?
Peter Gregory: That’s exactly what we saw during that period.
John Crum: Yeah, awesome. Well, thanks, Mark. The next section we’re going to talk about a little bit and we will change gears kind of but not totally. We will turn to Byron to give a high-level overview of economic outlook. Mark, if you could stay on the line, we are going to need your expert guidance on some of the points as well. Byron, why don’t you kinda take us through the overall economic outlook for 2018.
Byron Payne: This has been an interesting economic expansion. We’re in the 104 month of this expansion. The longest expansion we experienced post-war era was about 120 months and that was in the 1990s, you know right around the dot COM era and I think interesting thing for me, back then talking to the customers that felt like it had a lot more pop to it, a lot of energy and intensity.
It seems like this economic expansion, while long and certainly poised to potentially break the 120 months, felt like more like we’re bumping along and in talking to customers, they’re saying business is okay, but it’s not great and we’re bumping along. But, I do think there were a lot of things that point to the fact that this will exceed 120 months.
We’ve had the tax law changed and certainly a lot of the other indicators, consumer confidence, some of the other ones I mentioned, shipments of non-defense capital goods, capital goods are on the rise, and there’s a lot of things that point to the fact that I think we’re going to exceed the 120 months. Certainly, Mark, you have a lot more expertise in this area than I do. I’m curious to hear what your thoughts are.
Mark Vitner: I certainly think there is a good chance that we’re going to exceed the previous record for business expansion which was ten years or 120 months.
In order to do that, we’d have to make it through the middle of 2019 without another recession and certainly it looks like that’s possible. I know that given the recent volatility in the stock market, a lot of people are questioning that. But one of the things that I like to tell people about the market is if you look at the first three weeks of January when the market was doing nothing but going up, if you were to annualize that to the end of the year, the Dow would have been at 40,000 at the end of the year. People are a little nervous about the recent volatility but they’re giddy on the upside. I wouldn’t take too much away from the volatility of the stock market.
A lot of the concerns that have been making their way to the market has been because economic news has been so good that folks are worried that the Fed might raise rates a little more aggressively. And, I don’t think that should be a big concern right now.
It is certainly possible that the Fed will raise rates four times instead of three times this year, but that’s not anything to worry about. Interest rates are likely to remain low in 2018 and then 2019 under virtually any scenario, and credit is going to be readily available. When we talk to builders and developers, it’s competitive out there. It’s competitive out there to make loans right now. Credit is readily available. Typically, if the economy is going to run into trouble it’s because interest rates have risen to high levels and credit has become constrained and I don’t see that happening in the next couple of years.
Peter Gregory: Mark, all this positive information that we see and we talk about, what keeps you up at night? What concerns do you have? What is it? Is it inflation? Is it political event? Something like that? What do you see that could be something that could push us, you know, into a downturn or possible recession?
Mark Vitner: You know, I don’t lose much sleep over economic numbers. Our forecasts tend to be close to the consensus. We tend to be cautious in most of our assumptions and so if the news is a little better than we expect, I am delighted.
In terms of my biggest worry, they’re mainly in the geopolitical area and things that are beyond our control. One of the things that we learned from the financial crisis is that the world is so much more interconnected and a dislocation in one part of the world or one industry and bleed over into many other areas, and we saw that more recently with the Japanese earthquake in Fukushima and you think it’s a tragedy for Japan, it’s a tragedy there, but how that rippled through supply chains was a real dampener on the global economy.
The other thing that concerns me is China. China’s economy has become so large and they’re similar in some ways to Saudi Arabia became the swing producer in oil production, and they influenced the price of oil and to some degree, they still do.
China is the swing consumer and when China’s economy picks up, the global economy seems to pick up, and when it slows, the global economy slows. I don’t know if anybody understands the Chinese economy all that well.
I don’t know … when it comes to visibility as to what’s going on in China, how sustainable their growth, do they have a big, massive debt problem with
So that’s one of the trouble spots that I think about that worries me because I don’t know that anybody knows, and typically, things that you’re not looking for and people are not looking at, to trip up the economy and that’s the area that I would bet on is likely to trip us up at some point.
John Crum: Thanks for that, Mark. Before we get off the economic outlook or the picture there, we do get a lot of questions about residential construction, nonresidential construction, but one of the things that continues to come up is people that clearly are following the housing market, do you see any demographic trends or anything changing as it relates to residential building? We’re talking primarily about commercial construction. What are you seeing in terms of trends? Does demographics have anything to do with residential construction and the residential markets?
Mark Vitner: Well, demographics has a lot to do with the residential market. It’s actually, probably the key factor. I was on a panel in Washington, D.C. talking about this yesterday.
The area that most people are focusing on is the millennials. That is your new growth into the housing market. The leading edge of the millennials are now in their late 30s and at a point in their lives that they should be forming households. This is a generation that has taken a long time to get on its feet and establish themselves. There’s some very unusual aspects of this generation. 46% of millennial women have graduated from college. But just 36% of millennial men have graduated from college. Millennial women or women in general that have graduated from college like to marry men that have graduated from college, there’s not enough of them. There’s a matching problem. Even with all the online dating, it doesn’t seem to solve itself. The net result of that is that folks are renting for much longer periods of time.
That also contributes to the large number of people that are continuing to live at home with their parents, and there’s a lot of misconception about millennials. A lot of folks would think that they all live in these pricy apartments in downtown areas. Many do, but more millennials live at home with their parents or with other relatives than actually live in apartments, either downtown or in the suburbs.
So there’s a lot going on in that younger generation, but I think that the encouraging aspects, the most encouraging aspects I see with the millennials is that the labor market is strengthening. Yesterday’s consumer confidence is the highest we’ve seen in 17 years. The proportion of consumers that feel that jobs are plentiful is increased by more than 50% over the last year. And when see that kind of improvement in the economy in the past, you usually see more people coming into the workforce. We see folks that are in the workforce feeling more confident about their jobs and moving forward with major lifestyle decisions. Establishing a family and buying a home.
We think this year is going to be very good year for single family home construction. We’re looking for an 11% increase which sounds like a huge gain but it’s coming off of a very low base, and we also expect apartment construction to be stronger this year. We’re looking for about a 2% increase in apartment construction.
Peter Gregory: So Mark, with the millennials, we’ve seen that for several years now where more and more have been living at home. Is the trend now that they’re starting to get out more, get more apartments and buy more homes … is that part of what’s pushing the residential increase?
Mark Vitner: Well, it’s at both ends. We’re seeing that with the labor market improving more are going out on their own which is, I think, contributing to some of the surprising strength that we’re seeing in the apartment market, and at the upper end, the older millennials, it’s encouraging them more to move forward with purchasing a home.
Again, supply concerns are holding back a lot of folks. There’s just not a lot of homes to choose from. Builders have not been building a whole lot of starter homes.
Land development is one area where lending has not loosened up anywhere near as much as it had in prior business cycles and so we haven’t seen as much land development, there’s shortages of lots around much of the country.
John Crum: Thanks, Mark.
We’re going to change gears a little bit but before we go on, I want to remind everybody, we do have the opportunity and will save some time at the end of the webcast to take questions so if you do have some, put them in on “ask the question button”, or you can email and I think there’s an email address that was part of the invitation package (wfefmarketing@wellsfargo.com).
We’re going to switch gears a little bit and talking about one of our constituencies, distributors, rental companies, equipment manufacturers. Peter, this is your area of expertise.
Why don’t you kinda play the lead on the next few slides here and tell us what the industry is telling us expectations are for equipment sales.
Peter Gregory: Thanks, John. As Mark touches on the confidence in the economy, we’re seeing the same confidence in our distributors and their opinions of their sales of new equipment and used equipment. Also their rental fleet whether they will need to increase them. So some incredible numbers out this year.
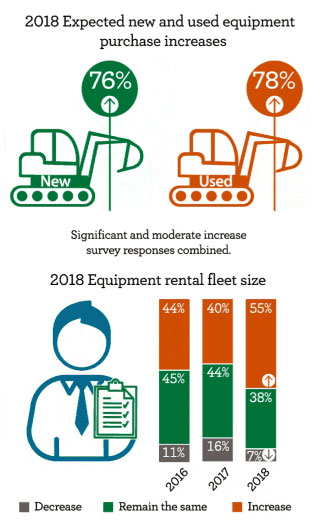
(Distributors expect) 76% of the distributors expect to have increased sales of new equipment and 78% of the distributors expect to have increased in used equipment sales.
Both are significant, double-digit increases from prior years but what’s a little more telling to me is that the increase in the used equipment sales.
We expect to see a lot of new equipment sales in good times, but the used part caught us off-guard a little bit.
Part of that, we’re finding out as we talk with our clients and the distributors and manufacturers’ side, that the dealers are ordering so much equipment, the manufacturers can’t build it quick enough.
We touched on a labor shortage, that’s part of the reason. Another part is the components. They can’t get them built quick enough to the manufacturers in time, so we’re seeing some of the order boards out three to six months for new deliveries and that’s something that we haven’t seen in a while.
So that’s something to keep an eye on.
As far as rental fleet size, 55% of the distributors expect to increase their rental fleets which is a big number.
You know, prior year was 40%. One thing I wanted to touch on is the next — the number below it is the green number of 38% and they expect to keep the rental fleet the same size, but it doesn’t mean they’re not buying equipment.
They sell a lot of equipment out of their rental fleet.
A lot of equipment ages out and put it in auctions and things like that, you effectively have 93% of the distributors buying more equipment for the rental fleet and that’s a big component of what we’re seeing in the sales.
And when we look at the distributors, 65% of them are renting more equipment now than they were in the prior year.
So that’s a big number. You know, they’re working hard to increase the utilization on the equipment they have, because when they can’t get what they need, they’ve got to do the best that they can with what they have.
John Crum: I see one of biggest numbers that jumps out at me is distributors and rental companies think they’re going to shrink their rental fleet and only 7% said the size of the fleet is going to decrease. That’s a pretty significant number from my perspective.
Peter Gregory: That’s almost half from the prior year.
John Crum: If you look at 16% in ’17 and 11% in ’16.
Byron, When you look at a number like this, what does it say to you in your experience across the platform of Wells Fargo, what’s happening with the rental fleet in general?
Byron Payne: That’s a good question.
It’s consistent with what we see in the some of the other business units in
Wells Fargo, whether it’s Wells Fargo middle market banking which is in the commercial space and probably Wells Fargo Capital Finance. Both provide credit facilities to dealers and what they’re seeing across the board is the dealers are either increasing usage of the existing credit facilities and in some cases, even asking for increases in the size of the credit facility to support this rental activity. It’s very consistent with what we see, John.
John Crum: Absolutely. I think that plays right into the next slide that we talked about here and going over this number. Peter, this is something I know you’re quite proud of in terms of an indicator when you are talking to your customers, Optimism Quotient versus total heavy equipment sales. What do you see here?
Peter Gregory: Yeah, this is a great number and so the total heavy equipment sales is new equipment sales and doesn’t include used, is measured as first in the dirt and also includes sales into the rental fleets.
So you know, as we see this historically the Optimism Quotient correlates really well with equipment sales and when we look at where the trend line is this year, we expect, you know, the equipment sales to really increase dramatically this year.
So … the types of equipment are listed down at the bottom of the chart.
So it’s mainly the heavy equipment that we’ll see in the contractor space and we’d like to thank our source, Andy Fanter, for providing this information to us.
John Crum: Absolutely. When you see a slide like this, besides setting budgets for your favorite divisions for the year, what do you see when you look at numbers like this and how closely it follows?
Byron Payne: Obviously this is really exciting as we are early in 2018 and Peter, you mentioned the correlation that we see. I mean, the correlation is almost spot on and there’s no reason to believe that in 2018 that we’re going to see the spend on construction equipment up which is going to give us the opportunity to finance more equipment. I don’t know that your business plans have been set and there’s a possibility after looking at this chart, talking with my manager, that we may have to increase these.
Not only that, but we talked about earlier that if it’s this high, it’s going to bode well for some of the other businesses that we have going on in the Wells Fargo Equipment Finance, and I think it bodes well for the entire Wells Fargo Equipment Finance platform in 2018.
I’m excited about it.
John Crum: Again, as an indicator, that’s something to look at when people are evaluating their businesses, it doesn’t predict anything.
It’s easy to look back see how well it looks but if you are getting a feel for what the industry thinks, and how it performs historically, this slide tells a lot.
So the next one, I think, is pretty interesting and you have some good insight on this slide. Peter, jump in here.
Peter Gregory: Yeah. This slide– this is an item that we’re talking about with our clients all the time, the rental rates. The rental fleets have increased so much and it’s a heavy expense for them, you know, it’s a difficult thing for them to figure out how to set the rental rates. They want to be competitive.
They want as much business as they can, but they also need to make sure that margins are good.
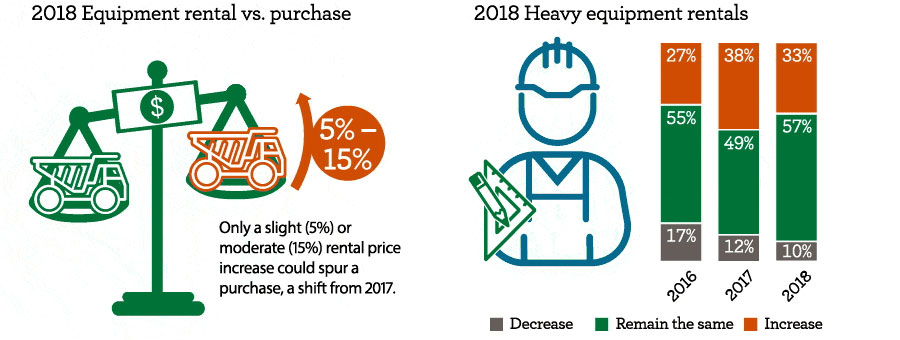
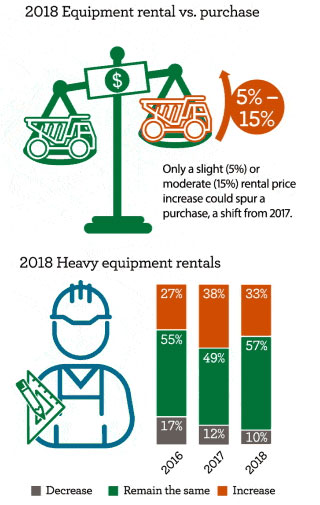
What we found is a slight to moderate increase of 5 to 15% would push a contractor to consider acquiring the equipment rather than continuing to rent, and that’s a big shift from prior years.
We haven’t seen that before and you know, they have to look at a lot of different things when they’re assessing that. But this is a big … could spot a big change in this industry coming for us.
We also look at the heavy equipment rentals and 33% of contractors are increasing their usage of rentals as part of their fleet management practice and so that’s a big increase and 57% expect to remain the same.
You are looking at 90% of the contractors out there who are utilizing the rentals and we expect that to continue to grow.
John Crum: I think one of the things you pointed out when we were talking about this is, you know, it really suggests maybe an equilibrium between availability of equipment to rent, when the contractors need it and it’s also priced right and it’s such a narrow, small increase in rental prices and we’ll get them to consider buying instead of renting it suggests that the industry is at the equilibrium point.
Peter Gregory: Make sense, yeah.
Byron Payne: John and Peter, with your experience over the last two or three years, what did this look like in 2016–2017, were we at equilibrium? Was it tipped one way or the other in terms of what might happen?
John Crum: We started this question, I want to say in 2016 … it might have been ’15. Going back to 2016, we provided commentary on it to the industry.
Our question was– that number was small, 5 to 15%. That amount of increase would only get about a third of them to consider buying instead of renting and so our question to the industry and our customers who are involved in it is, are you being paid enough? Do you have the equipment priced right? Are you getting paid enough for the rentals and for the risks you are being asked to bear there? Just in a two-year period, that number kind of the same scale and we have to double check the scale and if my memory is correct, it’s about a third, and one-third to two thirds with the same increase, you know, and what Peter had originally said and that equilibrium point so it seems like maybe the prices have gone up.
The ability is still about right and it seems like the industry is still in a good spot, Byron, for sure. Absolutely.
Peter Gregory: Part of the thing they have to think about also is, you know, if we’re in increasing rate environment so if we see rates increase a point to a point and a half, how is that going to affect their carrying costs? Do they have to eat that difference? Can they pass it on to the customers in the rental rates? And what to think about for them.
Byron Payne: Certainly the cost of capital could come into play and who knows, they may be offset about the new tax law that was passed. It will be interesting to see how it plays out in 2918.
John Crum: This is a question that we get a lot.
What impact will the rise of interest rates have? For certain, the costs of carrying a rental fleet is expensive and it’s primarily funded and if they’re borrowing unless they’re using equity and their costs will go up as interest rates rise and depending on what their fixed versus floating rate strategyis it may be sooner than later.
We’ve got our eye on that.
Peter Gregory: What’s interesting, too, we see a big number that are increasing rental fleet sizes — 55%, if you go back. That was done prior to the tax law change in December. So would it have been higher if it was done before it? Possibly.
John Crum: Before we move away from this slide, one thing I do want to point out is not an insignificant number. Even though 57% say they’re going to keep the rentals the same, rentals were really good last year and this was strong activity there and then like we saw with the number of distributors who are going to decrease their fleet, and the number of contractors who are going to rent less equipment has gone from 17% in 2016, so only 10% of the industry says they’re going to rent less equipment in ’18 versus ’17.
That’s not an insignificant piece there, certainly.
So certainly not last but not least, we have a couple more slides before we get to the Q&A.
Byron, overall industry net profits, what do we see in terms of what they are telling us expectations are?
Byron Payne: This is a positive number, John.
The fact that people see their profit going up in 2018 is really exciting.
The numbers are just starting to roll in from the contractors and the dealers for their 2017 experience and the profits were up pretty dramatically in 2017.
So the fact that the survey respondents in Q4 of ’17 were already indicating that they think the profits are going to be up in 2018 is a pretty strong statement and bodes well for the industry.
You know, the other thing that’s going on is back to the industry expansion, certainly a year ago, they looked two years out and 84% of the respondents said they thought that growth in the construction industry was going to continue. It slid back a little bit this time around, slid back to 76%, which starts talking about the year 2019 and probably dovetails nicely to what we see as well which is certainly that 2018 is going to be strong, little bit may be unknown into 2019 but still overall, even for 2019 very strong at 76% and 15% say it will remain the same. It looks good.
John Crum: I think it goes to what Mark was saying, too, right, get through ’18 should be pretty good and through mid-’19 and a little bit uptick people starting to think about, you know, what’s going to happen beyond 2019, if you look at that, 15% say it’s going to remain the same. Again, remain the same is pretty good.
’17 was a pretty good year and 9% think there could be a moderate contraction.
I don’t think we had any who said a significant contraction going on in 2019.
Peter Gregory: I mean, bring it up again, but these numbers of 61% expect increase and this was done, again, before the tax change, right?
Would that have affected that number pushing it higher?
John Crum: So moving on, one of the things if you have downloaded the report already and if you haven’t, I invite you to do so.
We can provide you with a hard copy as well and we would be glad to mail one to you.
We asked, “What are the top concerns in the industry?” We put what were selected as the top ones there and the one we talked about a couple times today, but the number one for contractors and I think number three for distributors around the companies is finding and paying for skilled labor. And consistently, and Byron, I’m sure it’s true for you and true for you, Peter, and it’s been on a lot of the same the calls, everywhere we go, we ask people what are their concerns, this would be number one.
Byron Payne: Absolutely, absolutely. It’s not only this industry. It’s just about every industry we operate in.
This has been definitely a challenge to find skilled labor. The labor market is really tight.
John Crum: I know we still have Mark on the line.
Is there any historical evidence, anything that says when we get to a labor shortage is that ever any kind of automatic governor or anything that can put a cap on growth? Is that something the industry has a right to be concerned on?
Mark Vitner: Well, the industry is right to be concerned about it. But it’s something that tends to come up every time the economy really heats up and you just can’t find good people.
I don’t know that it’s something that absolutely puts a tight level on growth.
It gets harder and companies are getting a little crafty in terms of ways to attract workers with paying bonuses as opposed to getting into a bidding war over wages and having signing bonuses and retention bonuses and it’s– and making the workplace more enjoyable.
It’s one of those things that when I hear about the millennials in the workforce and how you have to make them love their jobs more, and the idea that labor’s tight is something that I’m afraid we’re going to have to get used to. I really don’t see it changing for the better anytime soon.
John Crum: Thanks, Mark.
I’m going to lump rising health care costs right in with paying for skilled labor, right? I think those tend to go hand in hand.
I do want to point out and I know we have a question on this.
I’ll try to address the question as part of this concern, and that’s tax reform and legislation. So the survey was completed right before tax reform was passed.
That’s a question that was top of people’s minds. Then the question has come, “So what’s happened since then?” How would, or–how does the passage of tax reform impact optimism? Quite frankly, it’s improved it.
At least we’ll say anecdotally, it’s improved it. Our customers are very excited about it.
If I look at the activity level that we had just in our business right after tax reform was passed with 100% bonus write off, there was an immediate impact, as we talked to our dealers, same thing.
Sales increased almost immediately and I think there was a continued sense of optimism going into January from tax reform, but you guys hear anything different in terms of that?
Peter Gregory: When we have been at trade shows in early January and early in February, as we talked with some of our clients, they were … they couldn’t get enough deals done in December, and they were working till midnight on the 31st trying to get all the paperwork and everything done.
I think it had a major impact and I think it’s going to continue.
Byron Payne: You know, the other exciting part and you mentioned the bonus depreciation, Mark mentioned the bonus depreciation, the other exciting thing I will say for the contractors and dealers is the pass-through legislation which allows them now to pay the same corporate tax rate as a corporate tax, 21%, versus getting charged at the higher individual income tax rate.
That’s certainly been exciting for them as well.
John Crum: Mark, have you heard anything, anyone unhappy with tax reform so far?
Mark Vitner: Other than some partisan political folks, I haven’t heard anybody that’s unhappy with it.
The consumer confidence index rose in February in a time where we had all the market volatility.
Confidence rose and we saw a big increased portion of folks expecting their incomes to rise because February is when you begin to see withholding schedules change and paychecks get a little bit bigger. Another change I haven’t heard many people talk about is most home builders have all of their business in the U.S. and so they were paying very high marginal tax rates, 35% and the big national home builders and a lot of the larger regionals are going to see a big tax rate reduction, and this may make it possible to do more tract development and large national builders are the ones who have the greatest capacity to do that because they have the land and the lots to really ramp up construction.
I think that the timing could be particularly fortuitous in that we’ve been starved for product. We may see more starter homes get built.
John Crum: Mark, one of the questions that’s come in on the live stream is what areas do we see increase in land development and how does that relate then to infrastructure rebuild in those areas? Any thoughts in terms of where the hot spots are for land development and/or just overall construction?
Mark Vitner: Almost all of the sun belt, but certainly Florida from top to bottom is the strongest I have ever seen it. I’ve been an economist for 35 years.
The Orlando area, is year in and year out, is one of the strongest economies in the country. It’s not driven just by tourism.
In fact, you take tourism out, the numbers actually look better and the growth has been technology and aerospace.
Atlanta is back and in good shape and growing faster in more diverse space than we have seen in quite some time. Development is not as sprawling as it typically has been in Atlanta. More of the development is taking place closer into town.
It’s one of the fastest-growing markets in the country. Dallas, Houston, Austin, San Antonio, all continue to do incredibly well.
Dallas is probably the real star, though, in terms of the star performer.
We have so many corporate relocations coming to the Dallas area and you can see a lot of folks move there. Phoenix and Las Vegas and I would put Tampa going back to the other coast, are probably the three large markets that have seen the greatest relative improvement over the last year, and the inland areas of California, which had not seen all that much growth are now fastest-growing parts of California.
They have seen the fastest job growth and the inland empire is seeing the greatest increase and a lot of it is tied to transportation and distribution, but we’re also seeing a rebound in home building because the costs have risen so much along the coast and there’s a lot of good news out there.
All of the tech markets, the Seattles, the Denvers, San Franciscos, Bostons, they’re all doing incredibly well and you know, there are a lot of hot spots, and I think the story for 2018 is that a lot of the areas that hadn’t shared in the recovery, particularly in the upper Midwest and the south are likely to see stronger growth.
John Crum: Excellent. Thank you.
I think we’ve covered, “Are we at the top of market,” and we covered that significantly in terms of 104 months into this current expansion, the highest expansion on record is 10 years, 120 months and there’s probably pretty good indications that it can continue past that 120 months.
Obviously, nothing is certain but beyond that it’s really hard to predict.
Maybe, you know, 130 months, 128, it’s anybody’s guess. There is some evidence to suggest that we are sustainable here for at least the next 12 to 24 months and beyond that, we’re probably just guessing anyway, because so many things could happen.
With that, we do have a couple of questions from the audience that I want to take and the first one is — “Do we see the upcoming FASB rule changes affecting overall construction leasing in 2018?” I think that’s a good question.
In the survey, we asked the industry, are they aware of pending changes? And the answer is about half of them aren’t. Half of them aren’t even aware that there’s pending changes to lease accounting rules and of those who were aware, not a lot of them were significantly concerned about it.
They didn’t think it would be that impactful to them.
I think it’s a matter of who’s answering the question, more so than anything, right? If you tend to lease and tend to utilize off-balance sheet treatment for the leasing of your assets or the use of your assets, you are going to be more significantly impacted. I think that’s something that you absolutely want to be aware of, and we are highly recommending to all of our clients right now, make sure you’re aware of what impact that will have for capital goods, real estate and anything else that may be impacted there. Byron or Peter, any thoughts on pending lease accounting rules?
Peter Gregory: I think, you know, you touch on it.
It’s like if they’re leasing to get it off-balance sheet and that’s the only reason, yeah, they’ve got some things coming up.
People lease for different reasons. Some of them just want to tie it to certain jobs, you know, and the leverage ratio isn’t an issue for them so I think you will see them continue to lease. I think the ones who have been about doing it strictly for the off balance sheet treatment there, you know, they’ll probably have some changes in how they handle things in the future. But you know, for 2019, they go back on book for public companies. 2020 for private companies.
So they have a little more time to research it, but you know this is going to be a big deal for a lot of people and you know, we all suggest that they start talking to their CPAs and auditors now to get ready for it because it’s going to be a big event.
John Crum: We put that question purposely in there so the industry becomes aware, and at least to start thinking about it.
Something worth pointing out to a lot of clients and participants is, hey, if you are not aware of it, be aware. That’s the key thing there.
So we are running toward the end of the program here, so I want to give everybody an opportunity to really summarize their thoughts about the forecast, about what we’ve talked about.
Mark, let’s start with you on the phone? Any parting words of wisdom or thoughts as it relates to the forecast, industry, the economy as a whole? We’ve got three minutes left total. We’ll try to give a minute for everybody here.
Mark Vitner: Well, I would just say that things look pretty good this year and (inaudible) and what I find most ironic is with the economy improving, people are … the biggest concern seems to be, wow, with things getting this much better, is that something to worry about?
I would say no.
The improvement of the economy is durable, it’s lasting, it’s broadening and we’re improving for all the right reasons.
We will certainly have a recession at some point down the road but worrying about things that might happen or will eventually happen, the only thing that that does is ensure you won’t enjoy the moment when things are going right.
Peter, in 20 seconds or less, thoughts?
Peter Gregory: I appreciate everyone taking the time to complete the survey and it’s exciting time for us and for our clients and our industry.
We appreciate everyone and hand it back to you, John.
Bryon Payne: Once again, thanks everybody for participating today and I’m extremely excited about 2018.
I would mirror what Mark just said, which is it seems like people are I trying to find something negative about what’s going on.
I just don’t see it.
I think it’s going to be a great year.
John Crum: Thank you and in the last couple minutes that we have, I want to thank everybody here in the studio with us, and a special thank you to Michelle Hoffman from Wells Fargo Marketing and Kristin Harman for all the work they’ve done for the Construction Industry Forecast and everybody else we don’t have time to thank.
There’s a lot that went into this. Thank you very much.
For everybody who attended and stuck with us the full hour, thank you very much.
You can download a copy of the report at http://www.wellsfargo.com/constructionforecast and as always, we’re glad to talk about the contents of it at any time with anybody who would like to ask.
Thank you very much and have a great day. And we’ll talk to you soon.
U.S. national Optimism Quotient (OQ) highest in 20 years
The OQ for 2018 is a very strong 133. This is the highest point in 20 years. It’s a 10-point increase from last year and 25 points above the 2016 results, showing that respondents continue to feel very positive about construction industry activity in 2018.
| Year | Point |
|---|---|
| 1997 | 96 |
| 1998 | 105 |
| 1999 | 104 |
| 2000 | 102 |
| 2001 | 93 |
| 2002 | 88 |
| 2003 | 89 |
| 2004 | 103 |
| 2005 | 109 |
| 2006 | 102 |
| 2007 | 86 |
| 2008 | 80 |
| 2009 | 42 |
| 2010 | 66 |
| 2011 | 96 |
| 2012 | 114 |
| 2013 | 106 |
| 2014 | 124 |
| 2015 | 130 |
| 2016 | 108 |
| 2017 | 123 |
| 2018 | 133 |
Industry outlook
Optimism levels are higher for both contractors and distributors than they were last year. A belief in industry expansion and rise in net profits are cited as reasons for the increase.
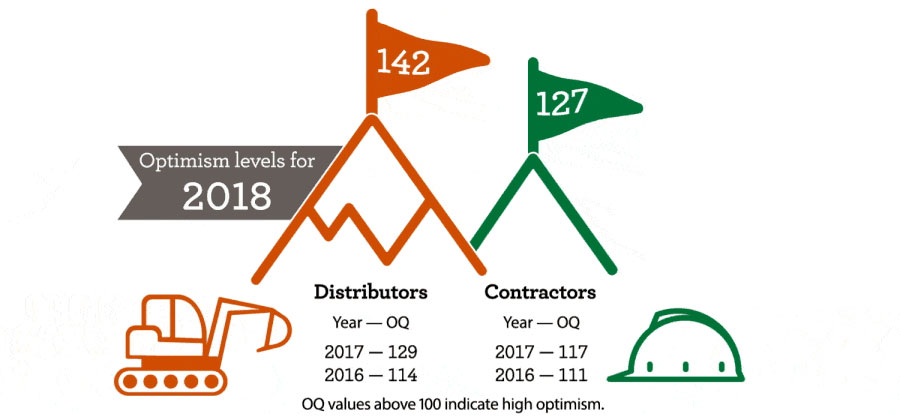
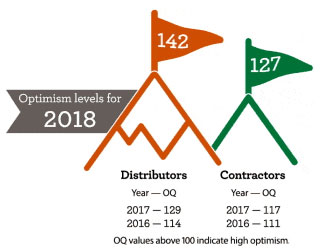
| Year | Distributors | Contractors |
|---|---|---|
| 2016 | 114 | 111 |
| 2017 | 129 | 117 |
| 2018 | 142 | 127 |
Net profits and industry growth
92% of respondents expect their net profits will remain the same or increase in 2018. Of those, 61% foresee a moderate or significant increase. A majority of executives, 76%, have a positive two-year outlook concerning industry growth.
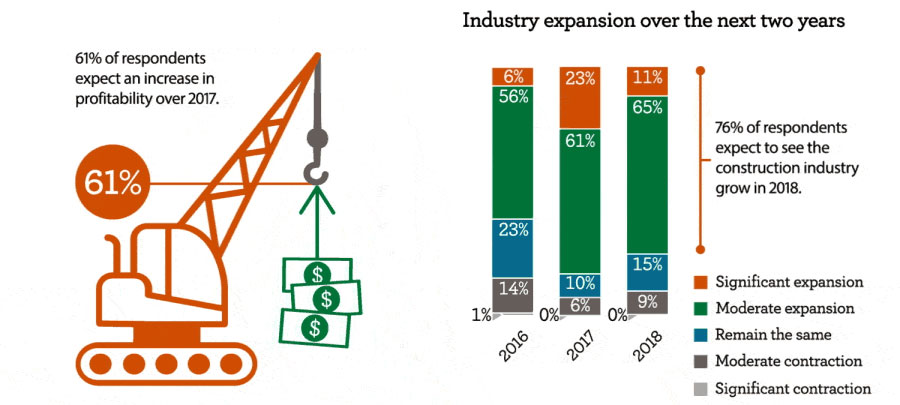
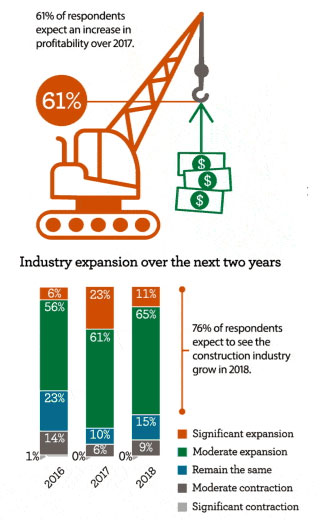
| Year | Significant Expansion | Moderate Expansion | Remain the same | Moderate Contraction | Significant Contraction |
|---|---|---|---|---|---|
| 2016 | 6% | 56% | 23% | 14% | 1% |
| 2017 | 23% | 61% | 10% | 6% | 0% |
| 2018 | 11% | 65% | 15% | 9% | 0% |
Equipment — Contractors
Contractors feel their fleet sizes are balanced. Those who plan to increase their fleet sizes will probably supplement with rentals. But even a slight increase in rental prices could cause nearly two-thirds of contractors to purchase equipment instead.
| Year | Increase | Remain the same | Decrease |
|---|---|---|---|
| 2016 | 27% | 55% | 17% |
| 2017 | 38% | 49% | 12% |
| 2018 | 33% | 57% | 10% |
Equipment — Distributors
Due to the anticipated increase in construction activity, distributors feel positive and expect increases in equipment sales, both new and used. More distributors plan to increase the size of their rental fleets over 2017 as they are renting to contractors more than in the prior year.
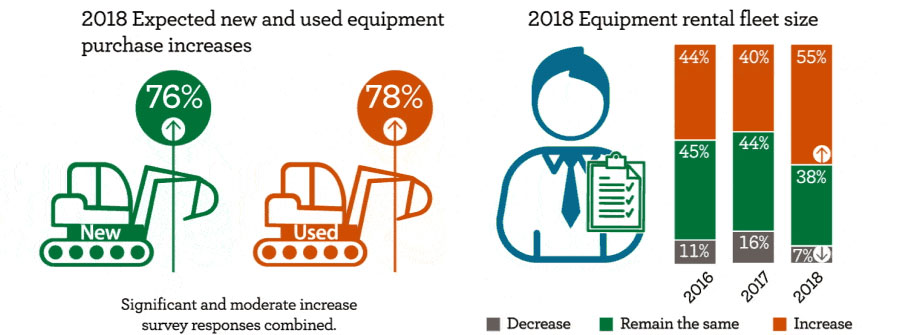
Among distributors, 65% are renting more than a year ago while 25% said rentals are about the same.
| Year | Increase | Remain the same | Decrease |
|---|---|---|---|
| 2016 | 44% | 45% | 11% |
| 2017 | 40% | 44% | 16% |
| 2018 | 55% | 38% | 7% |
Top concerns voiced by
contractors and distributors
A strong belief in industry growth and increased net profits fuels optimism for 2018. However, some concerns remain.
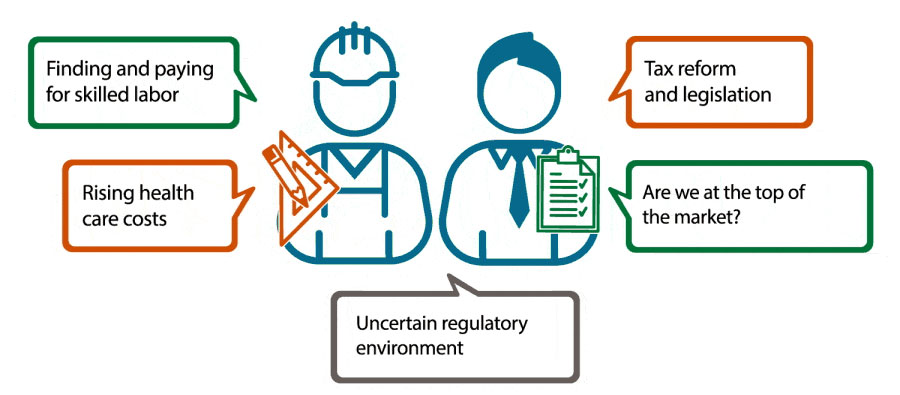
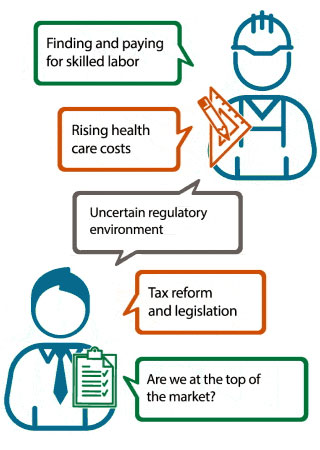
| Finding and paying for skilled labor | Rising health care costs | Uncertain regulatory environment | Are we at the top of the market? | Tax reform and legislation |
About us
Wells Fargo Equipment Finance (WFEF) provides businesses nationwide with competitive fixed- and floating-rate loans and leases that cover a full range of commercial equipment, floor planning, and inventory financing. We have industry financing specialists dedicated to construction, energy, commercial and specialty vehicles, marine, rail, aircraft, and vendor financing programs.
We offer a broad range of direct and vendor finance programs for equipment end-users, distributors, and manufacturers in the United States and Canada. Wells Fargo Equipment Finance is the leading bank-affiliated equipment leasing and finance provider in the U.S. and Canada, with more than $49.7 billion in assets under management,1, 2 more than 325,000 customers, and 2,600 team members.3
Construction equipment financing
We have deep expertise in the construction industry and offer tailored financing and leasing solutions. Our nationwide coverage allows us to connect our customers with the correct products to meet their financial needs and WFEF is the only provider that offers complete, creative financial solutions for the entire industry. With end-user leases and loans, dealer retail referral programs, dealer rental fleet and floorplan financing, and manufacturer subsidized retail and inventory programs, we have products suited to your particular needs.
For more information and assistance, please contact your local representative.
The 2018 Construction Industry Forecast
This report presents the results of Wells Fargo Equipment Finance’s wide-ranging survey of construction industry executives conducted in fall 2017. Drawing on the responses of construction contractors and equipment distributors from across the U.S., the forecast reveals trends in the industry and gauges the sentiment of industry leaders on a variety of business topics. View the full report to find out more.